This pulseEKKO PRO Data Collection page
is general to the pulseEKKO PRO system and will be useful for both the SmartCart and TR1000. However, a more specific page on data collection with the TR1000 can be found on the pulseEKKO PRO TR1000 Supplementary Information page.
After setting the survey parameters and time zero, data collection can begin.
Ensure the transmitter and receiver are powered ON and initialized by looking to see that the LED light is flashing. In the pulseEKKO PRO Main Menu, select the Run pulseEKKO PRO.
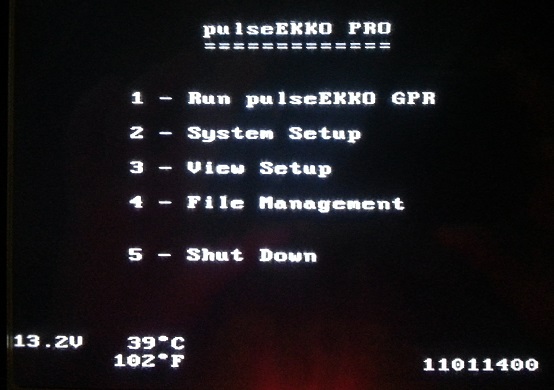
pulseEKKO PRO Main Menu Screen
In the pulseEKKO PRO GPR Run Menu, the user can select to set time zero in scope mode or to begin collecting data. Data can be collected along a line, over a grid, or without saving. Surveys where post processing is necessary, the user needs to save data as a line or grid; grid surveys are more detailed and require more attention. More can be read about these surveys below. Sometimes post processing is not needed, if a user is interested in locating and marking a known target below the ground. In this instance, a user may select the Collect Data (No Save) option. Other times, this option can be helpful if the operator is interested in performing test lines before starting a survey. Test lines may help the user determine proper parameters before starting a survey where results are saved.
pulseEKKO PRO Run Menu
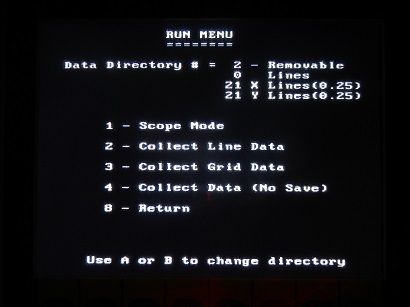
pulseEKKO PRO Run Menu
Line Survey
Line surveys can be a quick and accurate method to collect data along random paths or along lines that are not conducted on an orthogonal grid system that have equally spaced parallel and perpendicular lines. As long as the starting point and ending point of a straight GPR line is known, the geometry can be edited so the line can be correctly positioned on an orthogonal grid system. Thus, GPR lines collected in this mode can still be used by 3-D post processing software. Select a directory to save data to by pressing the A or B button. It is important to keep track of data. It is easiest to do this by keeping related lines in the same directory. Field notes are essential to the organized surveyor. Write down which directories contain what data. After selecting a directory, the user can collect data through a line survey, grid survey, or without saving. Press 1 to collect line data. By default, the first line will be 0. Subsequent lines will be 1, 2, 3, and so on. Each directory can hold 100 lines. If returning to a directory with lines, the user can view the current file, overwrite the current file, or use the buttons to navigate to the first line without data. Be careful when deciding to overwrite a record because it cannot be restored.
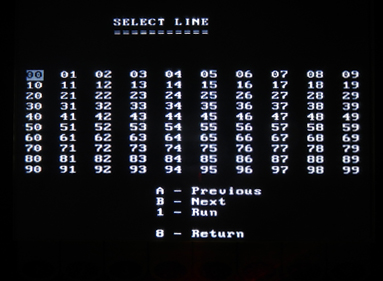
pulseEKKO PRO Select Line Screen
To navigate to a line, use the following buttons: A: Previous Line B: Next Line 1: Run 2: Setup Menu 8: Return After the Run button is selected, the pulseEKKO PRO will go through an initialization process. This process will communicate with all components and make sure they are ready for data collection. After initialization, a message will display if the connections are working as well as the DVL software version, DVL serial number, COM version, and COM serial number. Preferences can be changed to show more information if wanted although it is probably unnecessary for most users. If the initialization fails, the message will display what is wrong in hopes of troubleshooting the problem. After initialization is successful, begin to collect data.
Grid Survey
Grid data is a collection of parallel and perpendicular GPR lines. In contrast, line data may consist of GPR data collected along random line paths, spacings, and locations. If surveying for linear targets like pipes or facilities, the GPR will perform better if data lines are conducted perpendicular to these targets. Grid surveys are great for a more detailed analysis. Like the Line Survey, select a directory to save data to by pressing the A or B button. Keep related data together. Multiple smaller grids can be turned into larger grids if laid out correctly. In general, grid surveys are more accurate and detailed than line surveys. However, they take longer and the surveyor needs to take precautions to ensure accurate data. Press 2 to collect grid data. Decide whether to collect lines parallel to the the X axis (XLines) by pressing A, parallel to the Y axis (YLines) by pressing B, or both by using the A and B buttons. If only collecting lines along one axis, a grid still can be made. Grids made with both the X and Y axes tend to provide the greatest detail. When creating an XY grid, it is simplest to collect all the lines along one axis before collecting lines along the other axis because it encourages consistency through repetition of starting and stopping at the same points.
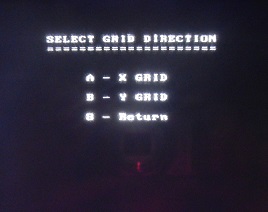
pulseEKKO PRO Select Grid Direction Screen
Select the line number. By default, the first line will be 0. Subsequent lines will be 1, 2, 3, and so on. Each grid can hold 100 X lines and/or 100 Y lines. Again, if returning to a directory that already has lines, the user can view the current line, overwrite the current line, or use the buttons to navigate to the first line without data.
pulseEKKO PRO Select Line Screen
To navigate to a line, use the following buttons:
A: Previous Line B: Next Line 1: Run 2: Setup Menu 8: Return After the Run button is selected, the pulseEKKO PRO will go through an initialization process. This process will communicate with all components and make sure they are ready for data collection. After initialization, a message will display if the connections are working as well as the DVL software version, DVL serial number, COM version, and COM serial number. Preferences can be changed to show more information if wanted. If the initialization fails, the message will display what is wrong in hopes of troubleshooting the problem. After initialization is successful, begin to collect data.
Data Acquisition Screen:
The data acquisition screen is divided into three sections:
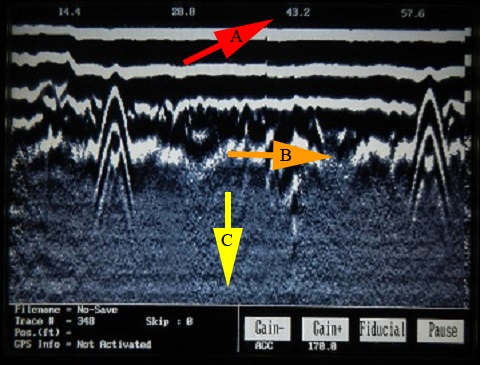
pulseEKKO PRO Data Screen Sections
Data Sections:
Section A
Section A, the top of the data screen, displays the position along a line. Distance is displayed in feet or meters, if the odometer is used. Otherwise, set the station interval to 1 during Free Run mode to count the number of traces.
Section B
Section B, the middle of the data screen, displays the data collected as well as any markers the user included during acquisition. The very top of Section B will usually have a thick black and white response, which is the radar’s signal passing directly through the air.
Horizontal Time or Depth Lines
are displayed in Section B after pushing the Pause button in Section C and implementing the Scale feature. Press the Scale button once for time lines and press it a second time to display estimated depths. While time lines are self explanatory, depth lines are horizontal lines that estimate a given depth and are somewhat dependent on the system settings. An accurate depth is dependent on the correct calibration of the SmartCart and the selection of an appropriate average velocity for the material being surveyed as well as the placement of time zero. More accurate depth estimates may be obtained during post processing or by using the calibration function, shown on the same screen as the scale feature. Set the width of the hyperbola to the desired average velocity (Calibrate Velocity)and place the peak of the hyperbola at a location on the screen where the user wants an estimated depth.
Fiduciary Markers
Fiduciary Markers are vertical dotted lines on the pulseEKKO PRO data display and are added by the user to mark significant points along a line. During data acquisition, a user can press the A button to add a fiduciary marker. The user should take notes about each fiduciary mark as he gathers data. The markers are named and numbered F1, F2, and so on. The Fiduciary Marker Button is displayed in Section C.
Section C
Section C, the bottom of the data screen, displays current data collection information such as file name and trace number as well as options to change how data is displayed such as the gain setting and average velocity calibration.
Current Data Collection Information
On the left side of Section C, the DVL will display a list of important information to the user. The Filename, usually a number, will appear on the top of this list. For example, the Filename may be “LINE0” for the first line of a survey. In the data acquisition screen above, the file name is displayed as “No-Save” because the GPR was being used in the No Save mode.
Under the Filename is the Trace #. It may be helpful in Free Run Mode to keep track of the number of traces. Remember to set the Station Interval to 1 if using the Trace # in Free Run Mode. To the right of the Trace # is the Skip indicator. This will tell the operator if any traces have been skipped. Skipped traces usually occur when the SmartCart is moving too quickly to acquire data. Slow down if the user is skipping traces. It may also indicate that an area needs to be resurveyed.
The Position indicator will display how far the odometer has traveled along a line in the measurement system selected by the user. This can be useful when locating and marking linear objects that are perpendicular to the SmartCart. If no position is being displayed, then the odometer is not being used, which may be the case in Free Run Mode. Otherwise, it may indicate a problem with the survey settings or an equipment malfunction with the odometer. Check to make sure the odometer is making good contact with the cart wheel if data does not scroll across the screen as the cart is pushed.
Last, the list displays whether the DVL is receiving GPS information. There are six possible GPS Info messages: GPS Fix means that standard GPS information is successfully being logged while DGPS Fix means that differential GPS information is successfully being logged. GPS Fix Type X means the fix type is X, a value greater than 2. Fix Not Valid means that GPS information is not being logged. This is usually because GPS satellites are not available. Not Activated means that the GPS is either not correctly configured or not being used. If the GPS is supposed to be connected then the user knows that it is not correctly connected. NO GGA means the GPS is not outputting the correct format, GGA NMEA, for the DVL.
Gain
Use the Gain + and Gain- buttons to modify the current Gain Settings. Underneath the Gain + button, the DVL will display the type of gain currently being used while the amount of gain used will be displayed under the Gain-button. Remember, gain does not make the GPR penetrate deeper nor does it change raw data. Too much gain will make it hard to distinguish between targets of interest and background noise. To avoid over saturating the near surface response, apply only enough gain to observe targets in the subsurface at the desired depth. It is important to note that the gain setting is intended to improve the DVL’s real time presentation of the data. Determining a good default gain setting early on will allow a survey to be completed more efficiently because there will be fewer adjustments throughout the data collection process. This process can be done in No Save Mode. Again, raw data will be stored unaltered regardless of what type and how much gain is applied to the DVL screen.
Fiduciary Markers
The Fiduciary Marker button is located in Section C, but the actual fiduciary markers are put upon the data in Section B. Again, fiduciary markers are vertical dotted lines added by the user to mark significant points along a line. During data acquisition, a user can press the A button to add a fiduciary marker. The user should take notes about each fiduciary mark as he gathers data.
Pause Button
The Pause button is important because a secondary list of options appear when it is pushed: Exit, Continue, Scale, and Calib.
Exit
Press the Exit button to stop data collection and return to the Data Line Screen. This is often done at the end of the line in order to choose another line number for the next record. It may also be done to exit this mode for checking the status of other menus.
Continue
Press the Continue button to resume collecting data. In this instance, the Pause and Continue buttons truly work together in order to stop a survey line momentarily. Perhaps, the user needs a bathroom break or wants to consult a colleague without interrupting the survey; this is a good option to stop collecting data while maintaining the ability to start collecting data along the same line. Remember not to move the SmartCart from its position if planning on resuming data collection.
Scale
By pressing the Scale button once, a time axis will appear left of the data image. If pressed twice, this axis will appear as a depth scale. An accurate depth is dependent on the correct calibration of the SmartCart and the selection of an appropriate average velocity for the material being surveyed as well as the placement of time zero. These depths may not be accurate if any of these variables are wrong. For a more accurate depth estimate of a target, push the Pause button and then the Calib. button. Using the calibration function, set the width of the hyperbola to the desired average velocity. Then place the peak of the hyperbola at a location on the screen where the user wants to determine an estimated depth.
Calib
Push the Calib. button to calculate the pulseEKKO PRO average velocity and to display depth estimates on the DVL. The best calibration values are from well defined hyperbolas with long tails. Poorly developed hyperbolas are difficult to curve match. A point or spherical object that responds well in the typical soil conditions of a survey will produce the best hyperbolas. Depth estimates are only as accurate as the chosen average velocity. Average velocities can change across a survey area, distorting the depth. Read about calibrating average velocity. As noted above, the Calib button is also helpful to determine the depth of a specific target on the DVL screen. Using the calibration function, set the width of the hyperbola to the desired average velocity. Then place the peak of the hyperbola at a location on the screen where the user wants to determine an estimated depth.