pulseEKKO PRO GPR is used to image different types of materials.
Determining the correct average velocity is important.
The pulseEKKO PRO is used to scan a myriad of subsurface conditions: soil, rock, concrete, ice, etc. These materials have different properties that affect the propagation velocity of the GPR’s signal. Selecting the proper pulseEKKO PRO velocity leads to better depth estimates. Though the calibration process is a tool intended for determining an average velocity, it is a great tool for estimating depths, as discussed on other pages.
Push the Calib. button after pushing the Pause button on the Data Collection Screen to calculate the pulseEKKO PRO velocity. The best calibration values are from well defined hyperbolas with long tails. Poorly developed hyperbolas are difficult to curve match. A point or spherical object that responds well in the typical soil conditions of a survey will produce the best hyperbolas. If an ideal response is not present, one may want to try an average velocity from the chart. Some of the best targets to use for calibration are small diameter spherical objects or small diameter buried lines. However, the user must cross a buried line perpendicular to avoid distorting the hyperbolic response. Be aware that larger diameter objects are likely to yield poor results because they have a tendency of widening the hyperbolic response. Depth estimates are only as accurate as the chosen average velocity. Average velocities can change across a survey area, distorting the depth.
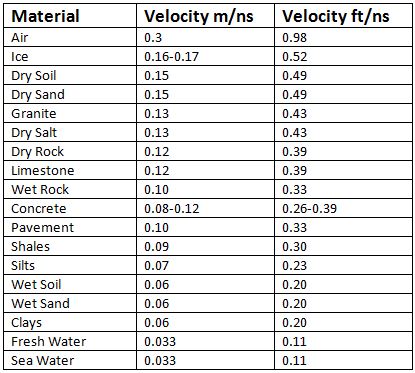
GPR Average Velocity Chart
Pick one of the two methods to determine pulseEKKO PRO GPR velocity.
Hyperbola Matching
One way to estimate a pulseEKKO PRO velocity value is to hyperbola match. Begin by collecting data. After traveling over a point object, the DVL will display a nice hyperbolic response. Push the Pause button to stop data collection while a well defined good quality hyperbola in typical soil conditions is still present on the DVL screen. Push the Calib. button.
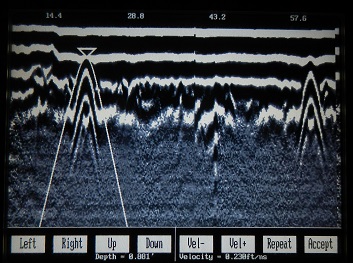
pulseEKKO PRO Hyperbola Matching Screen
The average velocity and estimated depth will appear on the bottom of the DVL screen and change with every widening or narrowing of the hyperbola. Once sufficient hyperbola matching has occurred, record this value, and enter it as the Velocity under the GPR Parameters menu.
Recognize “Air” Events
Although the vast majority of radar is directed into the ground, a transmitted radar signal is, in fact, released in all directions. Hence, some responses or hyperbolas are created from objects that are not in the subsurface such as trees, fences, overhead power lines, buildings, etc. Fortunately, these responses are characterized by their wide hyperbolic shape that yield a very high velocity value because radar travels much faster through air than the ground. When hyperbola matching, if the velocity is near 3m/ns or .984f/ns (the speed of light), the response is likely an “air” event from an above ground feature.
Using a Target of Known Depth
If a user can acquire an ideal response from a good target of known depth then one can estimate the pulseEKKO PRO velocity. Press the Calib. button, resulting in the hyperbola matching functions. Match the hyperbola tip to the top of the known target. Widen or narrow the hyperbola with the VEL+ and VEL- buttons until the depth on the display is the same as the depth of the known target. Note this velocity value and enter it into the GPR Parameters menu.