Press 2 in the Main Menu to go to pulseEKKO PRO System Setup Menu.
Press the appropriate button to access each menu.
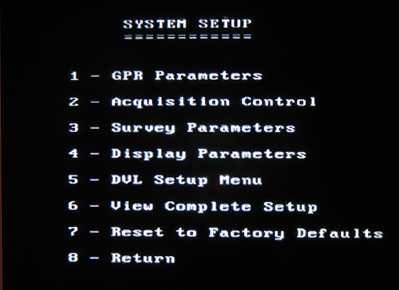
pulseEKKO PRO System Setup Screen
Press 1 to access the pulseEKKO PRO GPR Parameters screen. GPR parameters are fairly specific to the antenna frequency being used. It is necessary to set proper antenna parameters to produce quality raw GPR data as well as producing an interpretable DVL data display. Parameters can be changed depending on the antenna frequency, time window, sampling interval, antenna separation, antenna step size, radar velocity, system stacking and pulser setting.
pulseEKKO PRO GPR Parameters Menu

pulseEKKO PRO GPR Parameters Screen
Use the Arrow keys to scroll between each option and the A and B button to edit parameters. Suggested values are marked by an asterisk.
Antenna Frequency
Select which antenna frequency is being used to perform the survey, 50, 100, 200, and 1000 MHz antennas. The lower the frequency, the deeper the GPR can penetrate in ideal conditions. However, higher frequencies yield more detailed surveys. Most of the time, it is important to use the highest frequency antenna that will reach the desired target depth. The manufacture’s default settings, for an average velocity of 0.328 ft/ns, shows depths of penetration of about , 60 ft for a 50 MHz antenna, 30 ft for a 100 MHz antenna, 15 ft for a 200 MHz antenna, and 4 ft for a 1000MHz antenna, with ideal conditions. If the wrong antenna is selected, the GPR may collect results but the system will not function properly. It is imperative to select the proper antenna frequency.
Time Window
The Time Window is the amount of time the instrument will record a radar signal in nanoseconds. Lower frequency antennas record a radar signal for a longer period of time in nanoseconds, which when paired with a larger wavelength results in deeper penetration. The Time Window will be set to a default depending on which antenna is selected, but can be altered if not sufficient for the current survey. Remember the depth the GPR penetrates is based on the record length and average velocity (Depth= Velocity * (two way time/2), before applying any adjustments for the antenna separation or display settings).
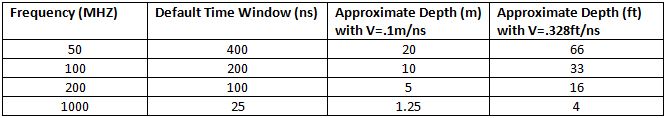
pulseEKKO PRO Time Window Table
Sampling Interval
The sampling interval is the amount of time in nanoseconds between readings. Each of reading creates a portion, referred to as a point, of the trace data. If the time between each point is too large, the data will consist of gaps, which lead to a poor representation of the response. In general, higher frequency antennas need a higher sampling rate or more samples per second. A higher sampling rate in conjunction with a shorter wavelength creates the higher resolution data sets that are available from higher frequency antennas. The sampling interval is set to a default depending on the antenna frequency. It is not recommended to change the sampling interval unless the user is very experienced. The default intervals for each frequency are as follows: 50=1.6 ns, 100=0.8 ns, 200=0.4 ns, and 1000=0.1 ns.
Antenna Separation
The antenna has a minimum antenna separation value. This is usually about the length of the antenna. The 50MHz antenna should have a separation of 2m or 6ft. The 100MHz antenna should have a separation of 1m or 3 ft. The 200MHz antenna should have a separation of 0.5m or 1.5ft. The 1000MHz antenna should have a separation of 0.15m or 0.5ft. An inaccurate antenna separation will result in inaccurate data collection.
Antenna Step Size
This is one of two places the antenna step size can be adjusted. The GPR SmartCart collects traces at fixed intervals, or step sizes. Antenna step size corresponds to an actual distance recorded with the odometer. Smaller targets require a greater amount of detail or a smaller antenna step size. On the other hand, larger objects may be suitable for a larger step size. Smaller step sizes will require more memory because a greater number of traces are required along a fixed distance. Therefore, take into consideration the amount of detail needed and implement best practices of surveying theory to gather the necessary quality data. Also, bear in mind that a smaller step size will require the cart to move at a slower pace than a larger step size. Moving the cart too quickly can result in missed or dropped traces. Recommended antenna step sizes for the 50MHz is 0.5m or 1.5ft, the 100MHz are 0.25m or 1ft, the 200MHz is 0.1m or 4in, and the 1000MHZ is 0.01m or 0.5in.
Radar Velocity
With the exception of setting display parameters and the placement of the zero time setting on the display, depth estimates are dependent on knowing a good average velocity. In real life, the velocity often changes throughout the subsurface because GPR travels through materials having different properties, which affects its speed. There are multiple methods to determine velocity. A radar velocity can be determined using hyperbola matching. Additionally, a Common Mid-Point Survey can also be used to find velocity if not using the PulseEKKO Pro with the SmartCart or TR1000 configuration. If neither of these options are a possibility, use the table below to find a reasonable estimate for the average velocity. No matter what method is used to determine the average velocity, remember that there is the possibility of an unknown margin of error.
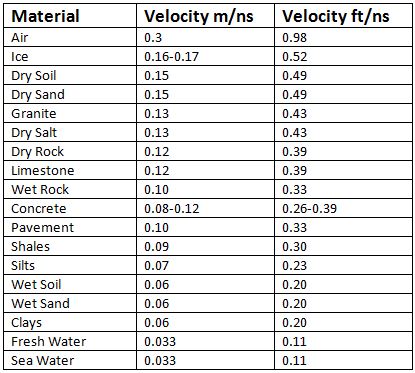
GPR Velocity Chart
If in doubt, a value of 0.0328 ft/ns or 0.10 m/ns is often selected and can be changed during post processing. The recorded GPR response is independent of the chosen average velocity value.
System Stacking
At times, GPR will not obtain quality data because of various reasons: cultural interference, electromagnetic interference, limiting subsurface materials, etc. A user may be able to improve the radar signal and diminish noise through a process known as stacking. System stacking is the process of taking multiple measurements or traces at one point and averaging them together to improve the signal to noise ratio. For example, a stack of 8 means the DVL added the response of 8 traces together to form a single trace. Stacking helps to reduce noise because, by definition, noise is random and does not stack (average) very well. Since stacking occurs, more or less, at the speed of light, the process takes place while the cart is being pushed. The number of stacks can vary from 1 to 2048 in powers of of 2 (1, 2, 4, 8, 16, and so forth). For most surveys, 4 to 64 stacks are recommended. Obviously, the more traces that are stacked, the longer it takes to create a single trace to store in the DVL. Because a larger number of stacks takes more time to collect, the SmartCart or TR1000 needs to be moved more slowly to avoid skipping traces. Therefore, it is important to be efficient. Perform the minimum number of stacks possible to gather adequate data. In most cases, the default will yield desirable results. Newer versions of the software have a setting called DYNA Q. This option will appear if the stacking is set to zero. DYNA Q is a setting that works with the odometer. It records a greater number of stacks when the odometer is moving slowly and fewer stacks when the odometer is moving quickly.
Pulser Setting
Specifiy which transmitter is being used with the pulseEKKO PRO system, whether it be a 400 volt or 1000volt transmitter. It is best to use the recommended default setting to avoid damage.
Exit
Push #8 to exit pulseEKKO PRO GPR Parameters