Determining the correct average velocity is important.
The Noggin Smart System is used to image a variety of different materials: soil, rock, concrete, ice, etc. These materials have different properties that effect the GPR’s signal. Selecting the proper Noggin Plus GPR velocity leads to better depth estimates.
Push the Calib.button on the run screen, either during or after a run, to calculate the velocity. The best calibration values are from well defined hyperbolas with long tails. Poorly developed hyperbolas are difficult to curve match. The best hyperbolas are formed when scanning a point or spherical object that responds well in the typical soil conditions for a survey. If an ideal response is not present, one may want to try an average velocity from the chart. Some of the best targets to use for calibration are small diameter spherical objects or small diameter buried lines. However, one must cross a buried line perpendicular to avoid distorting the hyperbolic response. Be aware that larger diameter objects are likely to yield poor results because they have a tendency of widening the hyperbolic response. Depth estimates are only as accurate as the chosen average velocity. Average velocities can change across a survey area, affecting the depth estimate accuracy.
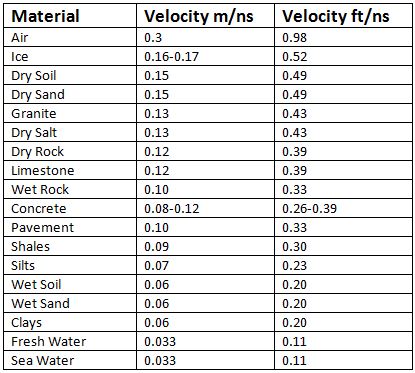
GPR Velocity Chart
If in doubt, a value of 0.0328 ft/ns or 0.10 m/ns is often selected and can be changed during post processing. Accurate radar signal detection will be collected regardless of the average velocity value.
Pick one of the two methods to determine Noggin Plus GPR velocity.
Hyperbola Match:
When the user selects Hyperbola Match, a synthetic hyperbola will appear on the DVL screen. The operator has the ability to move this hyperbola up, down, left or right. Match the top of the synthetic hyperbola with the top of the hyperbola observed in the survey results. Next, use the wider or narrower button to make the hyperbola match the data. The average velocity and estimated depth will appear on the bottom of the DVL screen and change with every widening or narrowing of the hyperbola. Once a reasonable hyperbola match is observed, record this value. Then, enter the value as the Velocity under the System Parameters menu.
When calculating the Noggin Plus GPR velocity or interpreting responses, it is important to recognize reflections from the air wave or “air” events.
Although the vast majority of radar is directed into the ground, a transmitted radar signal is, in fact, released in all directions. Therefore, some responses or hyperbolas can be created from objects that are not located below ground such as trees, fences, overhead power lines, buildings, etc. These responses are recognized by a, more or less, unique hyperbolic shape. The shape is different because radar travels much faster through air than the ground or other solid material. When hyperbola matching, if the velocity is near 3m/ns or .984f/ns (the speed of light), the response is likely an “air” event from an above ground feature.
Target of known depth:
The Noggin Plus GPR velocity is easy to estimate, if the user has a good quality GPR line that crosses a known object of known depth. Press the Target of Known Depth icon, a circle with a horizontal bar through it appears. This will superimpose a horizontal line that can be moved up and down. Move the line to the top of the known object. Next, adjust the velocity until the top of the object agrees with the known depth. Input this value into the Velocity value under the System Parameters menu.