Noggin Plus Data Display Overview:
Pick a Mode:
Data can be gathered in three different modes: Line, Grid, and Run without Saving Data. Decide whether to run without saving or setup a line/grid survey. Often it is appropriate to run without saving to investigate an area before setting up a line or grid. Running without saving is also a nice option to locate a specific target in a small area. Before conducting any GPR survey, always test the equipment and see how it responds over known conditions. Every site is different. Every site may not yield desirable results.
After selecting line or grid, choose a project number. Each line within a survey will have a file number. After selecting a file number press Run to begin collecting data. Press Stop to end collecting data for a line. Press exit, and select a new line number. The next line number without data is automatically highlighted. Take note that the correct line is recorded. Line numbers begin with 0 and end at 99. To replay a line, select it and press View. To rerun or write over a previously collected line, select it, and choose to rerun or overwrite the results. The DVL always asks if it should overwrite the file. If the user is sure he or she wants to redo a line, then select Yes. Once yes is selected, the previous data is erased.
Conversely, the Run without Saving Data mode begins collecting information immediately.
Pick a Start Option:
The easiest way to begin gathering data for the Noggin Plus data display is to manually press the Start button after the Noggin is turned on and booted up. The GPR system takes the longest to initiate for the first line. Settings may need to be changed beforehand for a specific survey. After pressing Start, the Smart system can begin gathering data while moving along a data line.
The user can also use the Auto Start option to prepare the system for data acquisition immediately after booting. If the Auto Start option is turned on, the user can press Run, automatically booting up the Noggin for data collection. This setting is useful when collecting many lines of data in a grid. It prevents the user from having to constantly push the Start Button and go through its options for each line.
In both modes, a Stop button will appear in the place of the Start button after data acquisition begins. By pressing the Stop button, data acquisition will be stopped and a new data line will be created. If using the odometer to collect data and there is a need to “pause” a line, simply stop pushing the cart and leave it at its position. In the odometer mode, data is not collected when the cart is standing still. This way, the operator can continue the line when he or she is ready without having to create another line.
GPR Noggin Plus Data Collection Screen
Gain Button:
The Gain Button, which changes the signal’s amplitude on the Noggin Plus data display, can be adjusted from 1 (the weakest) to 9 (the strongest) anytime while collecting data. Generally, shallow readings will need a weaker Gain setting than deeper readings. If the DVL screen is more or less blank, uneventful, or lacks detail, the user may need to turn up the Gain. If the radar is not penetrating to a desired depth, amplifying the signal will not result in greater penetration. Adjusting the gain does not increase penetration. Gain settings only changes how the data is presented on the Noggin Plus data display during acquisition or playback. Gain does not change the stored GPR data. Understand that too high of a gain setting may make it difficult to differentiate between targets of interest and noise.
Depth Setting:
This setting determines how long of a record is recorded and represents an apparent depth based on the record length in time. Time is used to calculate depth using an average velocity. It is important to note that depth is an estimate and is dependent on velocity. GPR determines depth by measuring the time it takes for radar’s signal to travel to and from an object at an average velocity. Depth is calculated as D = V x T/2. T is the two-way time or the time it takes for the GPR signal to travel to a target and back to the receiver. To calculate depth the two-way time is divided by 2 because depth is determined by the time it takes for the signal to travel only one way.
There is no guarantee that the Noggin Plus’s signal will penetrate to the desired depth. Be aware that in this situation, the GPR system continues to collect data as if it reached the desired depth. In areas where the radar cannot penetrate the subsurface material, the screen may appear to not have any events or be somewhat blank. In poor record areas, do not assume that there is nothing else below a strong response or that there is not a target of concern at depth if one is not observed on the DVL.
As a pointer, one of the best ways of reading depths from the DVL display
is by using the calibration function and setting the width of the hyperbola to the desired average velocity. Then place the peak of the hyperbola at a location on the screen where the user wants an estimated depth.
The average velocity varies depending on the material(s) being surveyed.
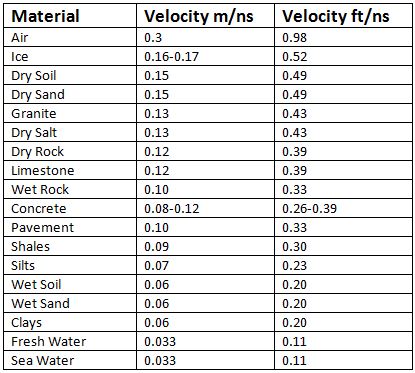
GPR Velocity Chart
Review Data:
After pressing the Stop button, the data line can be immediately reviewed on the Noggin Plus data display by scrolling through the data using the arrow keys. The user can zoom in on specific data within the line using the Zoom button. Some people find this very useful whereas others do not like to look at the data until it is completely collected.
Any data line can be reviewed by selecting the file number and pressing the Run button. In this mode, the data line can be viewed, overwritten, or deleted. Once a line is overwritten or deleted, it cannot be retrieved!
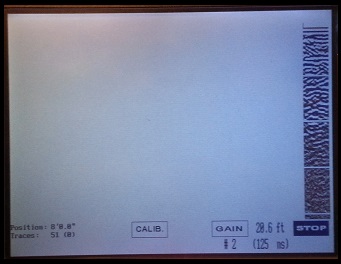
Data Acquisition Screen:
The data acquisition screen is divided into three sections:
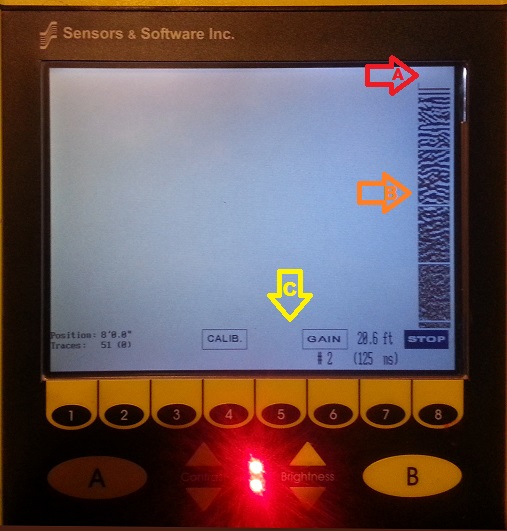
Noggin Data Acquisition Screen
Data Sections:
Section A
Section A, the top of the data screen, displays the position along a line. Distance is displayed in feet or meters, if the odometer is used. Otherwise, set the station interval to 1 during Free Run mode to track the number of traces.
Section B
Section B, the middle of the data screen, displays the data collected as well as any markers the user included during acquisition. The very top of Section B will usually have a thick black and white response, which is the radar’s signal passing directly through the air.
Depth Lines
Depth lines are horizontal lines that estimate a given depth. An accurate depth is dependent on the correct calibration of the SmartCart and the selection of an appropriate average velocity for the material being surveyed. More accurate depth estimates may be obtained during post processing or by using the calibration function. Set the width of the hyperbola to the desired average velocity (Calibrate Velocity) and place the peak of the hyperbola at a location on the screen where the user wants an estimated depth.
Fiduciary Markers
Fiduciary Markers are vertical dotted lines on the Noggin Plus data display and are added by the user to mark significant points along a line. During data acquisition, a user can press the A button to add a fiduciary marker. The user may want to take notes about each fiduciary mark as he gathers data. The markers are named and numbered F1, F2, and so on.
Section C
Section C displays the menu’s buttons and program settings, including the depth of data surveyed (which is calculated from the record length in time and the chosen average velocity), the Gain button and its current setting, GPS information if being used, the system’s current position and station interval, the Repeat Trace Number function (which is an indication of missing traces and a way to determine if an area needs to be resurveyed. Missing traces are often caused by moving the cart too fast), and the Calib button for calibrating the velocity setting.
Gain
The Gain setting can be changed during data acquisition by pressing the Gain button. The gain setting can be set from 1, the lowest, to 9 the highest. Increasing the gain, allows the GPR to amplify its signal. Often the screen appears speckled with little signal and few events when the gain needs to be increased. Too high of a gain setting can cause the display to over saturate, often making it difficult to identify zones of interest. Increasing the gain does not help if the GPR’s signal can not penetrate to the desired depth of investigation. It is important to note that the gain setting is intended to improve the DVL’s real time presentation of the data. The gain setting does not effect the recorded data.
Collecting Data using the Odometer:
It is a good idea to recalibrate the odometer before starting a new survey.
If collecting data with the odometer, the odometer triggers the GPR to collect a trace at fixed intervals, called the station interval. Although station intervals are adjustable, there are default station intervals for each Noggin system: Noggin 250 = 5 centimeters, Noggin 500 = 2.5 centimeters, Noggin 1000 = 1 centimeter. A data trace is plotted as a vertical strip on the screen. The width of the data trace is adjustable (1, 2, 4, or 8 pixels on the DVL screen). The defaults for data trace width are generally used. However, in some circumstances, changing the data trace width may provide a better presentation of the real time results on the DVL display.
Odometer Position
The current position of a properly calibrated SmartCart can be seen on the DVL in the lower left hand corner. The units of the odometer can be set to either meters or feet. Monitoring the odometer position may help in keeping lines the same length, if that is desired. Remember to start each line at the same location along a base line, if the results along parallel lines are going to be compared side by side.
Reducing quality data by moving to fast
The Noggin Plus has a high rate of data acquisition. However, data quality is reduced by moving too swiftly. Likewise, if the Smart System is collecting data using the odometer, traces will be skipped if the cart is moved too fast for the DVL to store. If a data trace is skipped, the last data trace gathered will be repeated. This will result in the Repeat Trace number being greater than 1. If the Repeat Trace number is greater than 1 or if the data screen looks blocky, data quality has been significantly reduced. The user has the option to AutoFix the data, a function that replaces the skipped traces with interpolated traces, which may create a less “blocky” appearance but will not make up for lost data. If the number of skipped traces is 10% or more, repeat the data acquisition by slowing down, reducing the survey’s depth, or reducing the number of stacks. In some surveys, it is unacceptable to have any missing traces.
Backing up the Smart System to Pinpoint Target Positions
The odometer mode allows the user to stop the SmartCart System in the middle of a data line and back up. When backing up, an arrow and vertical line moves backwards along the top of the display. The arrow corresponds to the cart’s movement backwards (Note: The user can only backup one display screen). Once the arrow on the display lines up with the target, mark the ground at the center of the Noggin. Continue to move forward along the original path with the cart, the Smart System won’t begin to collect data until you reach the position where you stopped collecting data. This process is especially useful when employing “search and mark” tactics.
Adjust the Arrow if needed in the Cart Parameters Menu.
Collecting Data in the Free Run Mode:
If there is a need to collect data without the odometer, the user can collect data in the Free Run Mode. However, this presents two potential obstacles. First, the Noggin system will continue to collect data even when it is not moving. Additionally, keeping track of the system’s positioning will be difficult. Positioning is often tracked using a tape measure, GPS, paint, flags, and/or fiduciary markers.
Data quality is affected by the speed at which the Noggin is moving and the speed at which the Noggin is collecting data.
Data Collection Speed
The Data Collection Speed in the Free Run Mode can be adjusted by increasing or decreasing the number of stacks. After decreasing the number of stacks, the data collection speed increases. Data Collection speed can be set with a time delay between data collection points. This may assist the operator to place the Noggin at a specific location by providing time to do so. It is important to note that when the time delay is more than 0.0, the Noggin will beep at collection points. This tells the operator it is OK to move.
Noggin Speed
The speed at which the Noggin moves determines the distance between station intervals in the Free Run Mode. A consistent, moderate speed is important for consistent results, especially between fiduciary markers used to scale the results. Experiment with the number of stacks and time delay to find a good speed for the Noggin. Collecting data too fast or too slow often makes it difficult to observe a desired feature in an otherwise good record area.
Positioning
In Free Run Mode, station intervals are not fixed. This means station interval distances are not correct. It is suggested that the station interval is set to 1 so that the position values can be interpreted as data traces as opposed to an absolute position.
Collecting Data using the Trigger
When it is not practical to use an odometer or the Free Run Mode, a user can collect data by using the Trigger (B) Button Mode. After selecting this option, determine the number of traces to collected for each stack. The DVL will beep every time it is collecting data; therefore, the more stacks per record, the longer the DVL will beep.
Positioning: When the odometer is not being used, it is up to the user to make note of positioning through another method such as GPS, a measuring tape, or fiduciary markers, etc.
Often, fewer numbers of data traces are recorded in this mode because it requires the user to manually press the trigger. Increasing the Data Trace Width may improve the real time presentation of the GPR data on the DVL display.