Time zero correction is set in the Run Menu
by pressing 1 to access Run pulseEKKO GPR
an then the pulseEKKO PRO Scope screen.
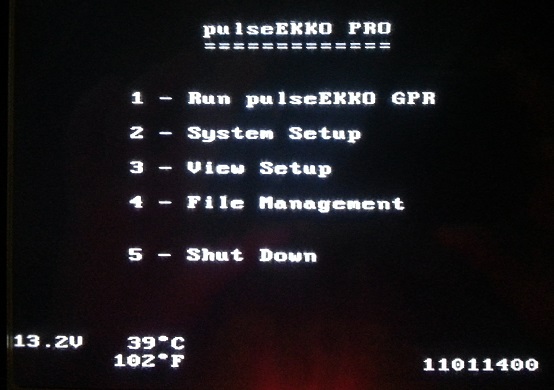
pulseEKKO PRO Main Menu Screen
The pulseEKKO PRO Scope Screen is used to confirm
that the system is working, that valid parameters are set, and that data can be collected. In this oscilloscope mode, the received radar signal is displayed as a wave form on the screen. Please note that portions of the information compiled below may be in conflict with the manufactures recommendations. Anyone reading this material will need to decide the validity of the information. While the material may assist, GPRTrainingCourses.com recommends that users, when in doubt, always default to the manufacture’s recommendations and manuals.
The Scope Menu offers three options: Start, Scale, and Exit.
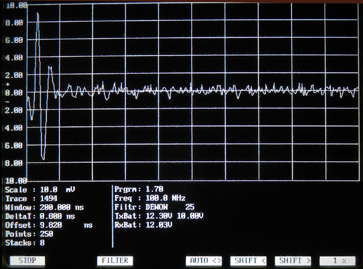
Press the Start Button to begin collecting data. If the offset is not too great, a wave form should appear as shown. The wave form is the response the receiver detects after the transmitter sends a pulse. Responses are not saved in a data file. The wave form, as shown in this diagram, needs to be adjusted per the manufacture’s recommendations.
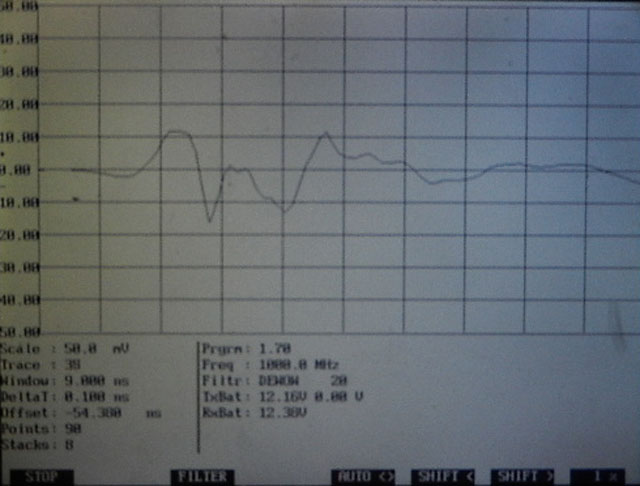
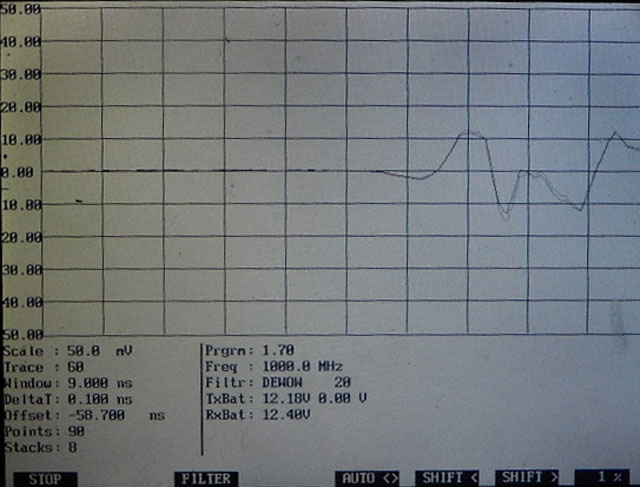
pulseEKKO PRO Scope Screen with wave starting too far to the left. Per the manufacture, the first arrival of the wave should start at about the first vertical division line right of the left hand side of the plot (the vertical line located slightly left and above the units mV).
The screen displays amplitude verses time.
The radar amplitude is measured in millivolts, plotted on the vertical axis, while the time window is displayed in nanoseconds along the horizontal axis. Each vertical division on the horizontal axis is one tenth or 10% of the time window. Displayed under the graph is the vertical amplitude scale, trace number, time window, sampling interval, time zero offset, number of points, stacks, frequency, and dewow filter. Press the Stop button to see more options.
If a GPR wave form is not observed, the offset needs to be adjusted.
First, try finding the pulse with the Auto <> button. The Auto button is intended to place the time zero correction (the first arrival) in an acceptable range on the display screen. If the pulse is not visible on the screen it may need to be located manually. Use the Shift > and Shift < keys to move the display left and right until the wave form is observed. The amount of time the signal is shifted can be increased or decreased by using the % button. A larger % shift value will increase the offset in larger amounts. Each time the screen refreshes, the wave form will be offset by a larger amount, plus or minus, until the shift key is hit again, to stop the movement of the wave form. If a large % shift is used, watch for the wave form to pass and note the approximate offset value. If the total offset becomes too great, start over by increasing or decreasing the offset value until is approximately 0, since some portion of the wave form will frequently appear at approximately 0 nanoseconds. Once the wave form is located, the placement of time zero or the first arrival can be more accurately placed using a smaller percentage scale (e.g., 1% or 5%). If a pulse can not be located then there is likely a problem someplace else in the system. Blindly setting the offset to 0 for data acquisition is not likely a good idea. The idea is to position the wave form so that time zero or the first arrival of the wave form is at approximately the first vertical line right of the vertical Y axis.
Time zero correction designates the starting point of the received wave form.
However, the placement of time zero on the scope display determines the placement of where the start of each trace will appear on the DVL display during data acquisition. The time zero correction changes with antenna selection, cables, and antenna separation. Make sure the antennas are separated by the distance required for the current GPR survey. Before collecting data via line or grid, check that the system is operating correctly. Set the location of time zero for the received pulse using the pulseEKKO PRO Scope mode. The position of time zero or the first break is mostly intended for the presentation of the results on the DVL display and is not intended to impact the raw data. Poor time zero settings will also lead to poor depth estimates on the display during a survey. Time zero is the first arrival of a radar wave and is used as a reference starting point for each trace. Time zero is used to denote where each traces starts at the top of the display while conducting a survey. If time zero is set too late on the scope or too far to the right then later portions of the response will arrive too late to be observed on the DVL, while conducting a survey. If the wave form is set to arrive too early or too far to the left on the scope, early near surface responses may not be displayed on the DVL, during a survey.
A detailed discussion is provided in the users manual on how to adjust time zero.
If time zero is not adjusted, additional unneeded data will appear on the DVL such as the ground/air wave. Sensors & Software points out:
- “The Offset is the value used to adjust the first break to the ideal region. The value has no importance to the radar data; it is only used for the adjustment of the initial radar pulse to the desired position within the time window. It compensates for changes in cables and differences in electronic components.”
- “Timezero should be located near the beginning of the second vertical division on the screen (Figure 14-2). Locating timezero to the right (further in time) of the second division has no ill effect on the data, it just means possible reflectors may be lost off the bottom of your recording window. Locating timezero to the left of the second division should be avoided.”
After adjusting time zero,
press Stop and Exit. You can now start to collect data, assuming all other parameters are set.
Example of a GPR time zero correction
demonstrates how depth estimates are displayed on the DVL display. Below are examples of time zero settings of approximately 10% (manufactures suggestion), 60%, and -20% of the full screen scope display. Each vertical division of the display represents 10% of the display. The following discussion is based on an average velocity of 0.328 ft/s for the concrete.
GPR time zero correction of 10%
Setting time zero by placing the first arrival of the received GPR signal near the first vertical division or 10% of the display is suggested by the manufacture.
GPR time zero correction set to 10 percent of full screen for a 9 ns 1000 MHz record
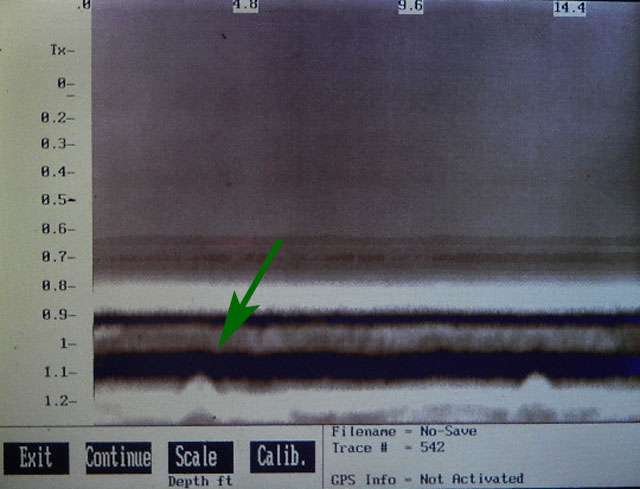
This time zero setting yields the following real time GPR record from over a reenforcing bar located in concrete.This setting yields an interpreted depth to the top of the reenforcing bar between 0.3 to 0.4 feet below the top of concrete.
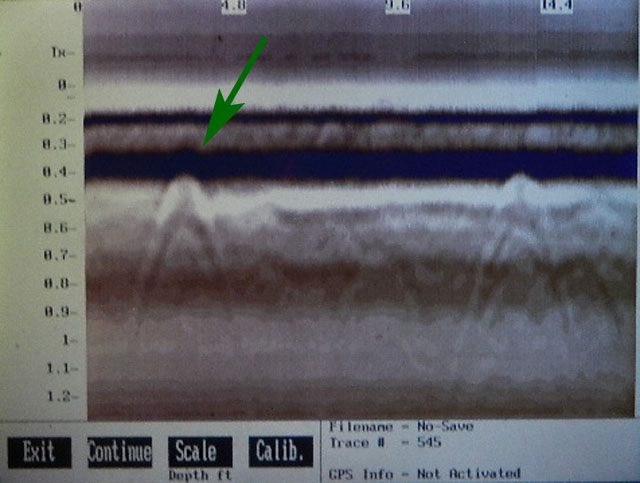
GPR depth estimates using a 10 percent offset of the time zero screen for a 9 nS 1000 MHz GPR record
GPR time zero correction of 60%
Setting time zero by placing the first arrival of the received GPR signal near the sixth vertical division or 60% of the display is likely a poor choice.
GPR time zero correction set to 60 percent of full screen for a 9 ns 1000 MHz record
This later time zero setting places the reenforcing bar at a much greater depth, a depth greater than the thickness of the concrete. This setting yields an interpreted depth to the top of the reenforcing bar between 1.0 to 1.1 feet below the top of concrete. This presentation of the results is clearly wrong.
GPR depth estimates using a 60 percent offset of the time zero screen for a 9 nS 1000 MHz GPR record
GPR time zero correction of about -20%
Setting time zero by placing the first arrival of the received GPR signal near -20% (estimated for demonstration purposes) is also likely a poor choice.

GPR time zero correction set to about -20 percent of full screen for a 9 ns 1000 MHz record
This earlier time zero setting places the reenforcing bar above the top of the concrete. This setting yields an interpreted depth to the top of the reenforcing bar at about 0.3 feet above the top of concrete. Once again, these results of little use.
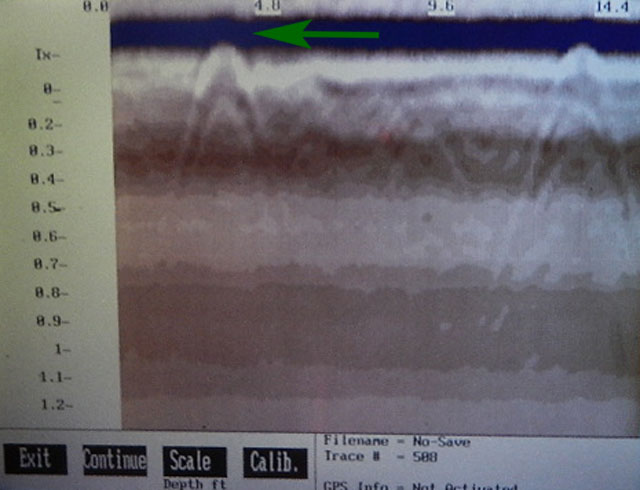
GPR depth estimates using approximately -20 percent offset of the time zero screen for a 9 nS 1000 MHz GPR record
Depth estimates using GPR
seem to be more accurately calculated using the calibration display (in this site’s opinion). While time lines are self explanatory, depth lines are horizontal lines that estimate a given depth and are thought to be dependent on record length and the placement of the time zero correction. This is in addition to establishing an appropriate average velocity for the material being surveyed. While tests support that the most accurate depth estimates are obtained with post processing techniques, additional testing suggests that the calibration function, shown on the same screen as the scale feature during data acquisition, may yield more desirable real time depth estimates than scaled time lines. To use the calibration function to estimate depths, the user needs to first set the width of the hyperbola to a desired average velocity (Calibrate Velocity). After the width of the hyperbola is established, depth estimates are calculated to the top of the hyperbola. Thus, placing the peak of the hyperbola at a location on the screen provides the user with an estimated depth. Field tests will help an operator determine which method may yield the most desirable results.